Volcanic processes; Morphology and Geochemistry through GIS
A list of selected resources for Geography 560; Introduction to Geographic Information Science, Oregon State University, Winter 2022, final project.
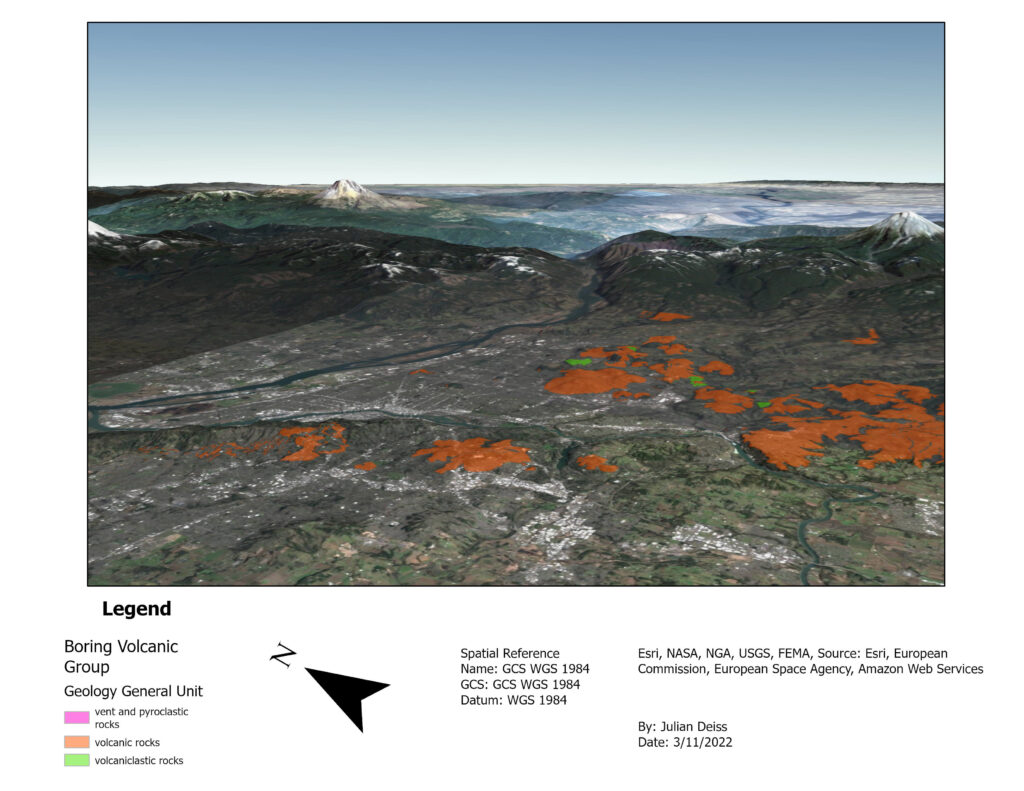
Volcanic process to me are distinct and abstract in their morphological and temporal processes. Relative process; lava flows can be seen through successive layering and relative placement, and by the more absolute radiometric dating techniques. These events occur dramatically; Mt. St. Helens and the Hawaiian Islands, but cumulatively span over of millions of years; just like the invisibility of radiometric dating vast times frames are difficult to comprehend. Morphologically volcanism can create prominent features; Mt. Hood for Portland, and Mt. Rainer for Seattle. There is also the Boring volcanic field, full of monogenetic features; many well weathered and covered in vegetation with Portland emplaced on part of it; a rich layer cake, even still it can seem unremarkable. On the grand scale was the change of an entire ecosystem with the rise of the Cascade mountain rage resulting in present day Eastern Oregon, along with the Columbia river plateau basalts. Regardless of the process or time frame, volcanism and geochemistry are data rich; temporally and spatially. My interest is understanding the relationship between geochemistry and volcanic morphology and how it changes over time. Fundamentally I am a story teller, these are epic stories told through the organization, analysis and presentation of data.


Web Pages
U.S. Geological Survey Astrogeology Science Center. August 31, 2021. S P Mountain Field Guide. https://storymaps.arcgis.com/stories/7429fafe0af644f8a5e4e88e50992072
A guide to the San Francisco volcanic field in Flagstaff AZ with a focus on the monogenetic cone named S P Mountain. On this website the visitor is given a background as it relates to volcanology starting from the large; planetary volcanism through the volcanic field its self and to the context of S P Mountain. Visitors to the site are also provided with direction to access the site and field stops at the location.
Papers
Achieng, Joline., Mutua , Joseph., Mibei , Geoffrey., Olaka, L., Waswa , Aaron K. 2017. Mapping of Hydrothermal Minerals Related to Geothermal Activities Using Remote Sensing and GIS: Case Study of Paka Volcano in Kenyan Rift Valley. International Journal of Geosciences, 8, 711-725.
- Landsat
- DEM
- Classification
- Hydrothermal
Through analysis of landsat 7 ETM image data, and DEM in ArcGIS the authors investigated an area of interest with respect to geo and hydrothermal activity. Through these processes lavas at Paka Volcano were processed in both supervised and unsupervised classification to best identify promising location based on their alterations into indicative clays. Each of their clays had identifiable reflectance spectra. This spectra in conjunction with proximity to faults in a known volcanically active area produced a map with areas of promise for geo and hydrothermal activity.
Beaudoin Y., 2001. Physiogy, Geology and Geochemistry of the Southern Explorer Ridge Seafloor Hydrothermal Site Using an Integrated GIS Database and 3D Modeling. Master of Science Graduate Department of Geology, University of Toronto
- TIN
- Seafloor
- Bathymetry
- Hydrothermal
This thesis was on the mapping of the physical and chemical character of the Southern Explorer Ridge on the seafloor located off the coast of British Columbia, Vancouver Island. The bathometry of seafloor was represented in a GIS using a Triangular Irregular Network. This data was collected via transect passes pulling sub surface sonar equipment that’s relative surface location was methodically calculated. Additionally, samples were collected and analyzed and mapped into an overlaying surface. By combining these data sets the author inferred how magma’s movements were related to faults and volcanic structures.
Bukumirovic , T., Italiano, F., Nuccio , P.M. 1997. The evolution of a dynamic geological system: the support of a GIS for geochemical measurements at the fumarole field of Vulcano, Italy. Journal of Volcanology and Geothermal Research 79. p. 253–263
- Fumarole Field
- GIS
Using a GIS the authors created a temporal sequence of fumaroles on the field ‘La Fossa di Vulcano’ of Vulcano in Italy. By combining records dating over a 10 year period they created a sequence showing the expansion of the field in addition to its increased steam output over the same 10 year period. Taking this information and linking the volcanic activity observed they established the expanding and increased output of the area and steam respectively correlated to increases of volcanic activity. Form this spatial and temporal analysis of fumarole activity they concluded that volcano-tectonic activity brings magma closer to the surface.
Brož , P., Hauber , E. 2011. A Unique Volcanic Field in Tharsis, Mars: Monogenetic Cinder Cones and Lava Flows as Evidence for the Hawaiian Eruptions. 42nd Lunar and Planetary Science Conference (2011) 1379
- Satellite imagery
- Remote sensing
- Mars
Due to the increase of higher resolution of image data from satellites around Mars the amount of data has increased. In this study the surface morphology and spatial analysis of a monogenetic volcanic field was conducted. In this work the authors compared trends in cone structure from Earth to their Martian counterparts and discussed their findings and how they diverged from prediction at their study location. From their analysis they discovered that Martian cones more closely resemble their Earth counterparts in relative proportions for their total volumes, a conclusion that was counter to thinking Martian cones would present a more compressed morphology.
Bluth, G. J. S., Carn, S. A. 2008. Exceptional sulfur degassing from Nyamuragira volcano, 1979–2005. International Journal of Remote Sensing. Vol. 29, No. 22, p. 6667–6685.
- Sulfur Dioxide
- Remote Sensing
Volcanic eruptions emit large quantities of gasses during eruptions, that can have effects both locally and globally. This research was on better quantifying the Sulfur Dioxide emissions of a very active volcano in the African rift; Nyamuragia located in the Democratic Republic of the Congo. For this the researchers turned to remote sensing via satellite observation from Nimbus-7, ADEOS and Earth Probe TOMS. These observations spanned between 1979 to 2004 and captured the release events of 14 eruptions. To more accurately quantify eruptions lasting multiple days they created a set of assumptions and a set of analysis parameters for evaluating their spectral satellite data. From this they determined that this period of observation emitted a globally significant about of sulfur dioxide into the atmosphere. Despite this significant quantity of sulfur contribution, the authors felt it was still a low estimate. They did determine that a majority of sulfur emission was typically within the first three day of an eruption, however how this correlated to solid eruptive material and what its implications for the volcano’s magmatic source was outside of their study.
Bruno B. C., Fagents S. A., Hamilton C. W., Burr D. M., Baloga S. M. 2006. Identification of volcanic rootless cones, ice mounds, and impact craters on Earth and Mars: Using spatial distribution as a remote sensing tool. Journal of Geophysical Research, Vol. 111
- Nearest Neighbor (NN)
- Rootless Volcanic cones
- Remote sensing
- Linear alignment detection
With the acquisition of higher resolution imaging on Mars the authors investigated the Nearest Neighbor technique for the identification and differentiation of Rootless volcanic cones, ice mounds and impact craters. This analysis was performed for sets of these features on both Earth and Mars. From this analysis the authors discussed and investigated the initial set up of the analysis and its implications for the final result. From this research it was determined that sets of these features had a meaningful statistical difference between these object classes based on location (Earth and Mars) however the morphologies between Earth and Mars were not determined to be similar enough that one set of planetary parameters would translate across to the other. However, the ability to statistically differentiate between these features remotely based on image analysis is exciting for remote analysis of planetary volcanic processes.
Edwards, B.R., Bye, A. 2003. Preliminary results of field mapping, GIS spatial analysis, and major-element geochemistry, Ruby Mountain volcano, Atlin volcanic district, northwestern British Columbia. Geological Survey of Canada, Current Research 2003-A10.
- TIN
- Geochemical
Through sampling and subsequent geochemical analysis coupled with mapping in ArcView the authors objective was to determine the volume, area and extant of the eruptions from Ruby mountain in Altin BC, and to distinguish it’s activity from other volcanic activity and other processes.
Fornaciai, Alessandro. Favalli , Massimiliano. Karátson, Dávid. Tarquini, Simone. Boschi, Enzo. 2012. Morphometry of scoria cones, and their relation to geodynamic setting: A DEM-based analysis. Journal of Volcanology and Geothermal Research, 217-218, p. 56–72
- DEM
- Scoria Cone
- Volcanic Field
The morphometry of scoria cones and their respective volcanic fields were evaluated using DEMs to determine if there was a relation between geologic context and cone shape. The authors began their analysis by examining multiple DEMs to determine the detail need to conduct this analysis. They determined minimum DEM resolution was inversely proportional to cone size. By selecting several attributes that can be extracted from a DEM the authors numerically analyzed and then modeled rates of erosion and its effect on the cone morphology to determine if geological setting had an influence on the cone’s primary morphology. Ultimately through their model they could determine a difference, however, from empirical data it was less certain due to long term varying environmental factors, which may influence cone degradation at key stages in erosion.
Gohu, Radu; Dietrich, Volker; Jenny, Bernhatd; Scheandner, Florian; Hurni, Lorenz. 2006. A geo-spatial data management system for potentially active volcanoes – GEOWARN project. Computers & Geosciences, 32, 29-41.
- GIS
A suite of data relating to volcanism in two active regions (Greece and Italy) was entered into a GIS as a way to better visualize and evaluate data over time, from which the goal was to create an interface to better query, analyze and predict volcanic activity. The goal of this combination of many data types with a GIS was to be able to better forecast volcanic activity. The authors elaborate on the variety of data that is available and discuss its difficulty in working with many different data sets over time and study type. By incorporating the data into a GIS the authors show that larger analyses can be made across multiple study sites and data sets. This also places all the data with a system that may then be more easily queried for other predictive, or visual analyses.
Gonzalez, A. Rodriguez., Turiel, J.L. Fernandez., Torrado, F.J. Perez., Aulinas , M., Carracedo, J.C., Gimeno , D., Guillou , H., Paris , R. 2011. GIS methods applied to the degradation of monogenetic volcanic fields: A case study of the Holocene volcanism of Gran Canaria (Canary Islands, Spain). Geomorphology, 134, 249–259.
- DTM
- GIS
- Monogenetic Field
Using GIS as a one of several factors to evaluate and reconstruct surface topography pre, post and current of eruptive processes in the study areas on Gran Canaria, in order to asses factors controlling rates of erosion/degradation on cones and lava flows was conducted. To generated DTMs pre-eruptive process the authors relied on detailed topographic maps (1:5000) and, sampling techniques to establish the extant and thickness of lava flows and cones. As part of this process Gran Canaria was divided into four distinct areas representing areas of volcanism age and climactic conditions. In each of these study areas erosive features were categorized and evaluated to determine if the conditions had measurable effect on erosion. From this it was determined rates of erosion were less controlled by climactic conditions and more by terrain and volcanic process; slope and lava flow vs cone morphology.
Head, Elisabet M., Maclean , Ann L., Carn, Simon A. 2013. Mapping lava flows from Nyamuragira volcano (1967–2011) with satellite data and automated classification methods, Geomatics, Natural Hazards and Risk, 4:2, 119-144, DOI: 10.1080/19475705.2012.680503
- Landsat
- Classification
- DEM
- Radar Imagery
Through remote sensing the authors conducted an analysis of a volcano located in the Democratic Republic of the Congo. Additionally, Nyamuragira volcano is located in physically remote and in difficult terrain. Bothe these factors; political instability and remote/difficult location make the monitoring of this site particularly difficult even for originations in the areas do the former. Despite these site attributes there are people in the area that are impacted by volcanic activity. To conduct their analysis they selected remotely sensed data from multiple sources: Landsat multi- spectral scanner (MSS), thematic mapper (TM) and enhanced thematic mapper (ETMþ), and Earth Observing-1(EO-1) Hyperion and Advanced Land Imager (ALI) imagery. Using these data they were able to construct a scheme where they could separate lava flows based on age. Some of these determinations were based on the difference between reflectance of vegetation and lava flow, and others were based on the difference in reflection between lava flows. The former being where lava either abutted healthy vegetation or where the underlaying lava flow was sufficiently old to support a weather cover that produced reflectance that was similar to plants. The former where different bands were analyzed that were more robust to the reflectance of weathered minerals. From this they determined classification of lava flows is viable as a solution to lack of regular physical access.
Mulliken, K.M., Schaefer, J.R., and Cameron, C.E., 2018. Geospatial distribution of tephra fall in Alaska: a geodatabase compilation of published tephra fall occurrences from the Pleistocene to the present: Alaska Division of Geological & Geophysical Surveys Miscellaneous Publication 164, 46 p. http://doi.org/10.14509/29847
- Geodatabase
- Tephra Fall
- Digitize
Alaska has a significant number of volcanoes and lies along the ring of fire for a significant portion of its coast line. From these volcanoes there have been many eruptions producing tephra fall out, however, the studies defining these areas have been conducted over many years from 1978 to 2016 with the authors focusing on the geologic time frame from the Pleistocene to present. Previously these studies results were not located in a single easily queried digital source. Additionally, not all studies had the same information for a single event, the same types of information on events, and if it had been digitized. The goal was to create a single geodatabase that contained all these sources.
Robidoux, Philippe; Roberge, Julie; Adams, Cesar. 2020. Spatial Visualization of Geochemical Data: Application to the Chinchinautzin Volcanic Field, Mexico. Updates in Volcanology – Transdisciplinary Nature of Volcano Science, IntechOpen, 389-411.
- DEM
- Kriging
In “Spatial Visualization of Geochemical Data: Application to the Chinchinautzin Volcanic Field, Mexico” the authors explored how spatial analysis tools combined with geochemical data can elucidate details of a complex volcanic field and its magmatic sources. In this study the authors combine previous studies geochemical data; specifically, the elemental ratios of Alkalis vs SiO2, Sr/Y, and Ba/Nb as indications of magma origins, their locational data in conjunction with a DEM and apply spatial analysis tools of: Kriging, Linear Decrease, Inverse Distance Weighting and Moran’s Index to compare these geochemical markers.
Santos S. Fernanda, Sommer A. Carlos, Haag B. Murico, B’aez A. Walter, Caselli T. Alberto, Ba’ez D. Alejandro. 2022. Tectonic controls on geomorphology and spatial distribution of monogenetic volcanoes in the Central Southern Volcanic Zone of the Andes (Argentina). Geomorphology 402 108130.
- Categorization of monogenetic cones (Spatial analysis?)
- High Resolution DEMs (remote sensing)
- Categorize by morphology (Image analysis)
- Establish relationships to faults and features (topology)
- Google maps as preliminary identifier
- Kernel Density
- Average Nearest Neighbor
In this study the authors examine the monogenetic deposits in the central southern volcanic zone in the Andes through the use of newer high resolution DEMs, and spatial analysis. Because these events are singular in nature, they are a good snapshot of processes at a point in time, however because of their prevalence (relative to polygenetic features) can be more difficult to study. Using remotely sensed data (images and high resolution DEMs) analysis of cinder cones and maars were placed into groupings based on their attributes of age based on slope, aspect, and orientation of their foot prints based on the distortion of a polygon, which in turn was used to detail a large time/space/mechanism of eruption history with respect to the larger region of plate tectonics. From this evaluative process a more strategic approach to geochemical analysis could be conducted maximize efforts to costs.
Shehri , Azizah Al., Gudmundsson , August. 2019. Unsupervised classification of lava flows in Harrat Lunayyir using remote sensing and GIS. Arabian Journal of Geosciences, vol. 12, p. 522
- Remote Sensing
- Unsupervised classification
The authors studied a lava flow in Harrat Lunayyir, Saudi Arabia using remote sensing to make an unsupervised classification of different flows in the larger complex. The technique the authors decided upon for the classification was processing the reflected spectrum obtained from Land Sat 8 OLI data and processed using an iterative self- organizing data analysis technique (ISODATA). From this classification they distinguished between successive flows based on their change in reflectance based on weathering and biological (lichen growth) processes. From this unsupervised classification they chose three sites for sample collection and radiometric dating. Results from dating and remote sensed data were compared this to existing geologic as a comparative assessment. They found that unsupervised classification was able to distinguish between lava flows of different ages in this field however, reflectance was not proportional to age.
Vörös, Fanni., Vries, Benjamin van Wyk de., Karátson , Dávid., Székely, Balázs. 2021. DTM-Based Morphometric Analysis of Scoria Cones of the Chaîne des Puys (France)—The Classic and a New Approach. Remote Sensing. 13, 1983. https://doi.org/10.3390/rs13101983
- Morphology
- Lithology
- DTM
- Cinder Cones
In this research the examination of a field of monogenetic scoria cones was conducted via analysis of high resolution of DTM that allowed for a different methodology due to the greater data density of these DTMs. They compared their methods to methods derived from different studies at other volcanic fields. Using the DTM analysis the authors examined the relationships of age, morphology, and lithologies to see if significant differences were present between the lithologies of cinder cones. From their analysis they discovered that determining mean and median slope of scoria cones was more accurate using a DTM that by previous work using 1:50,000 topographical maps (Hasenaka, Charmichel. 1985). While lithology did seem to be a driving factor in morphology the authors concluded additional factors would be needed to elucidate more drivers of morphology.
Wetherell, K., Edwards, B., Simpson, K. 2005. Preliminary results of field mapping, petrography, and GIS spatial analysis of the West Tuya lava field, northwestern British Columbia. Geological Survey of Canada, Current Research, 2005-A2.
- TIN
- Tuya Volcanic Field
The authors conducted a re-examination of a geologic feature in northern British Columbia know as the Tuya Volcanic field. Their study area contained what they determined to be three separate volcanic features (vents) that all erupted in roughly the same time period and were overlapping. These three shield style volcanoes were also determined to have erupted most recently in the last interglacial period of the Pleistocene based on observed glaciation, however, much of the eruptive volume would have been under an icesheet or glaciers based on the morphology. Previous studies determined the lavas were trachytic in nature, however, with their further investigation it was determined they rather basaltic in nature. The total eruptive volume was estimated by mapping in ArcGIS and using a TIN. The volume estimates had much variability due where the basal elevations were set, additionally the authors concluded that it is likely a large quantity was lost to erosion.
Lagniappe
Corradino, Claudia., Ganci, Gaetana., Cappello, Annalisa., Bilotta, Giuseppe., Hérault, Alexis., Negro, Ciro Del., 2019. Mapping Recent Lava Flows at Mount Etna Using Multispectral Sentinel-2 Images and Machine Learning Techniques. Remote Sensing. Vol. 11, p. 1916.
Gong, Liwen., Li, Ni., Fan, Qicheng., Zhao, Yongwei., Zhang, Liuyi., Zhang, Chuanjie. 2016. Mapping the topography and cone morphology of the Dalinor volcanic swarm in Inner Mongolia with remote sensing and DEM Data. Front. Earth Sci. Vol. 10(3). P. 578–594.
Hasenaka, T.; Carmichael, I.S. The cinder cones of Michoacán—Guanajuato, central Mexico: Their age, volume and distribution, and magma discharge rate. 1985. J. Volcanology Geotherm. Research, 25, 105–124.
Hemmi , Ryodo., Miyamoto, Hideaki. 2017. Distribution, morphology, and morphometry of circular mounds in the elongated basin of northern Terra Sirenum, Mars. Progress in Earth and Planetary Science. Vol. 4, article 26.
Kereszturi , Gábor., Németh, Károly., Cronin, Shane J., Agustín-Flores, Javier., Smith , Ian E.M., Lindsay, Jan. 2013. A model for calculating eruptive volumes for monogenetic volcanoes — Implication for the Quaternary Auckland Volcanic Field, New Zealand. Journal of Volcanology and Geothermal Research, Vol 266, p. 16–33.
Koji Kiyosugi. 2012. Temporal and Spatial Analysis of Monogenetic Volcanic Fields. Dissertation for the degree of Doctor of Philosophy Department of Geology, University of South Florida, Graduate School at Scholar Commons.
Mamani, M., Worner, G., Hartmann, G., Cassard, O. 2005. A GIS-based isotope map of the Central Andes (13 05-28 OS) and implications for ore formation. 6th International Symposium on Andean Geodynamics (ISAG 2005, Barcelona), Extended Abstracts: 464-467
Marliyani. G. Indah., Helmi Hurien., Arrowsmith, J. Ramón., Clarke, Amanda. 2020. Volcano morphology as an indicator of stress orientation in the Java Volcanic Arc, Indonesia Journal of Volcanology and Geothermal Research, 400, 106912.
Melián , G. V., Toulkeridis , T., Pérez , N. M., Hernández, P. A., Somoza, L., Padrón, E., Amonte, C., Alonso , M., Asensio-Ramos M., Cordero , M. 2021. Geochemistry of Water and Gas Emissions From Cuicocha and Quilotoa Volcanic Lakes, Ecuador. Frontiers in Earth Science. Vol. 9, Article 741528
Sweetkind, Donald S., Rytuba, James J., Langenheim, Victoria E., Fleck, Robert J. 2011. Geology and geochemistry of volcanic centers within the eastern half of the Sonoma volcanic field, northern San Francisco Bay region, California. Geosphere; June 2011; v. 7; no. 3; p. 629–657
Contact
Questions, Comments, Concerns? Let me know!
